Savonia Article Pro: From a Pile of Gravel to a Number: How a Drone Survey Becomes a Measurement
Savonia Article Pro is a collection of multidisciplinary Savonia expertise on various topics.
This work is licensed under CC BY-SA 4.0


A walk-through of a stockpile survey — from the site visit and the drone flight to a single click that returns a volume
Measuring how much material sits in a stockpile sounds simple: look at the pile, draw a line around it, and read off a number. In practice that single number rests on a whole chain of steps — a visit to the site, a drone flight, a great deal of computing, and a careful check against a known reference (Al-Naim 2026). This article follows that chain from start to finish, without the heavy technical detail, to show how a heap of gravel becomes a measurement you can trust.
It starts on the ground
Every survey begins with a site visit. On the morning of the flight the team arrived at the material yard, walked the area, and checked where the piles sat in relation to roads, water and working machinery. Before the drone leaves the ground, a few markers are placed on the open surface so the imagery can later be tied to real-world positions. Only then is the aircraft set up and the flight prepared.
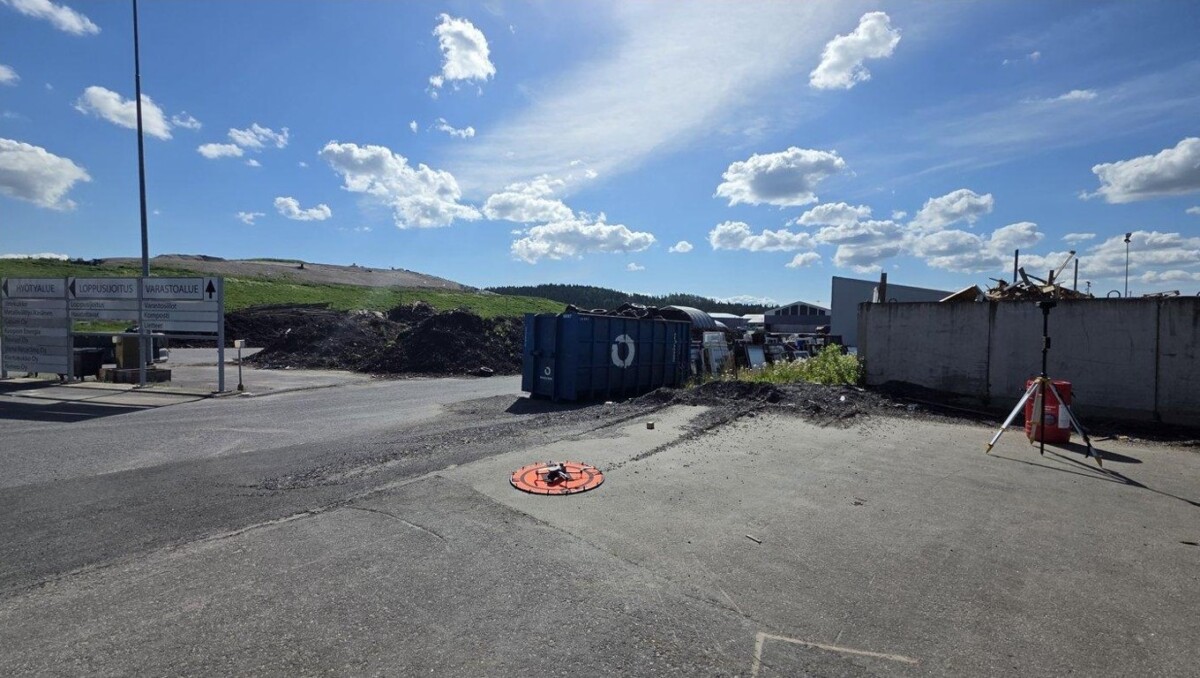
Picture 1. The material yard on the morning of the survey — the working environment the drone had to map.
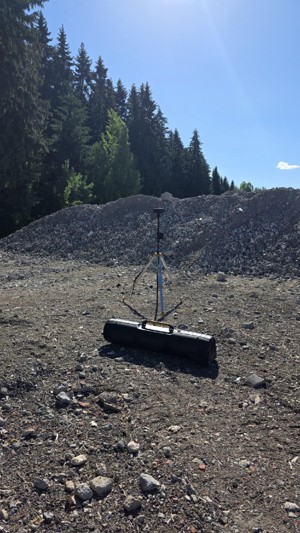
Picture 2. A ground reference marker placed on the open surface before take-off. DJI D-RTK-2 base station obtain a signal from GNSS satellites and provide correction to Drone location data
Then the drone takes over
With the site prepared, the drone flies an automated grid, taking overlapping photographs of the whole area from above. The pilot sets the flight on the controller and watches the live view as the aircraft covers the yard line by line. For this survey, seventy-five images were captured — enough overlap for the software to later rebuild the scene in three dimensions (Al-Naim 2026).
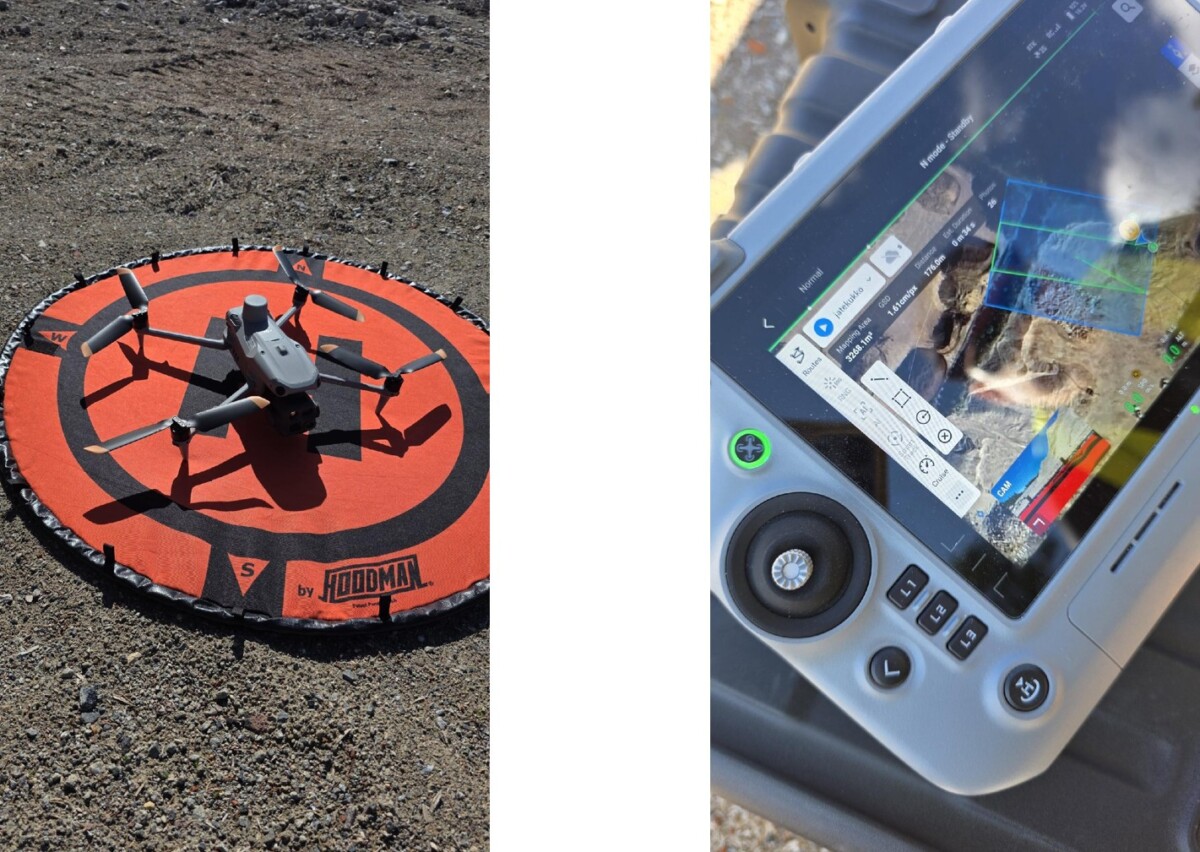
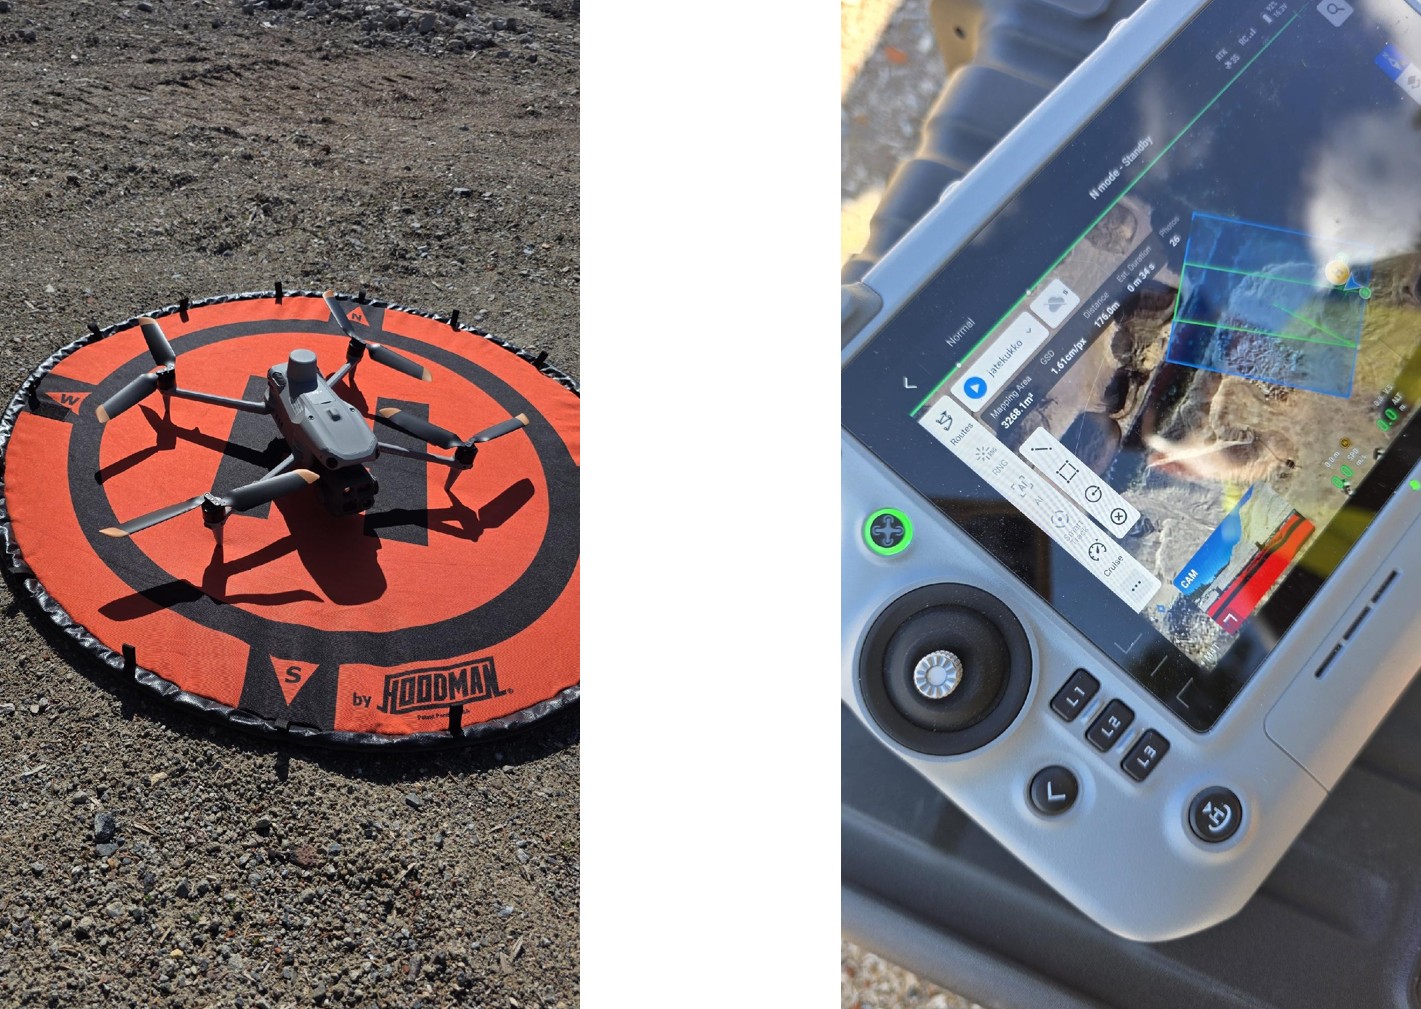
Picture 3. Left: the UAV prepared for take-off. Right: the automated flight grid planned on the controller.
From photographs to a 3D model
The photographs on their own are just pictures. The processing software stitches them together and reconstructs the site as a 3D surface, producing an aligned top-down image of the yard together with a height model of everything in it (Al-Naim 2026). At this point the gravel pile is no longer a photo — it is a measurable shape with a footprint and a height above the surrounding ground.
One click, one measurement
The 3D model is opened in a simple web dashboard, and instead of tracing piles by hand, the operator clicks once on the pile. The tool finds the edge of the heap, draws an outline, and reads off the volume, the ground area and a confidence rating — and the outline can still be nudged by hand if the automatic edge stops short (Al-Naim 2026). The base level under the pile is fitted to the outline at its foot, the same “Mean Plane” method the commercial DJI Terra software uses.
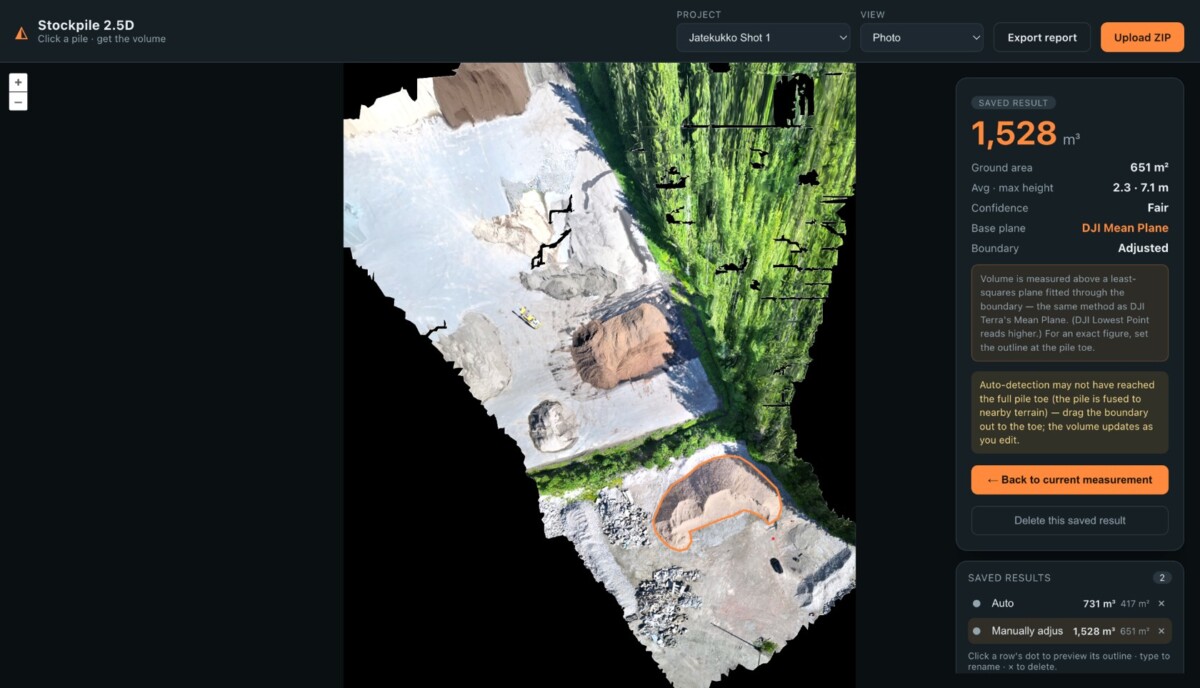
Picture 4. The Stockpile 2.5D dashboard: click a pile in the map and the measured volume, area and confidence appear on the right.
Measuring the same pile three ways
To see how trustworthy the one-click result is, each pile was measured three ways: by the tool’s fully automatic detection, by the tool’s manually adjusted outline, and by DJI Terra — an established commercial package — used here as an independent reference. The two surveyed piles tell slightly different stories.
Shot 1 — the concrete-fines pile
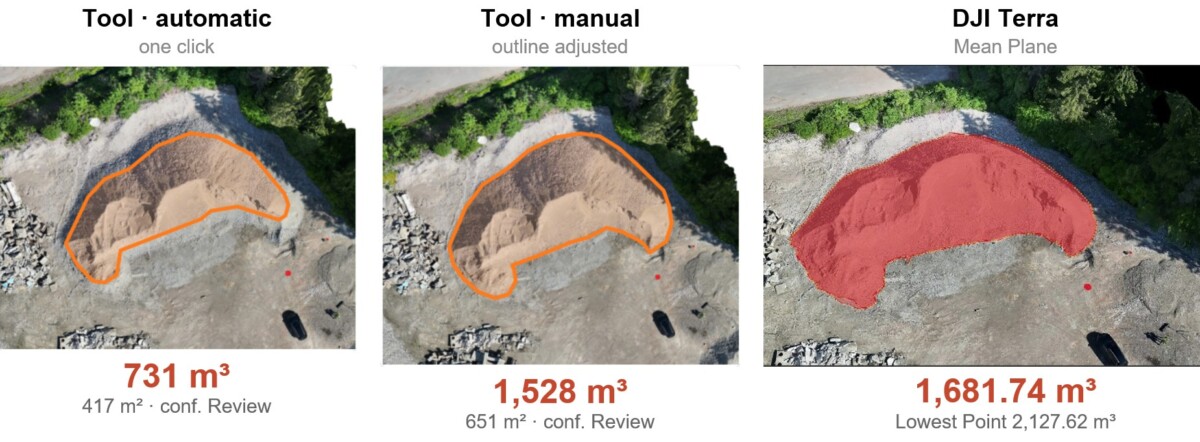
Picture 5. Shot 1: the automatic outline stopped short because the pile is fused to the ground around it; after the edge was dragged out to the pile toe, the manual figure lands close to DJI Terra’s reference.
Here the fully automatic detection under-read at 731 m³ and flagged itself for review, because the pile blends into the surrounding surface. Once the outline was pulled out to the foot of the pile, the manual measurement (1,528 m³) moved much closer to DJI Terra’s Mean Plane figure of 1,681.74 m³ — exactly the kind of check-and-adjust the tool is designed to support (Al-Naim 2026).
Shot 3 — the crushed-rock pile
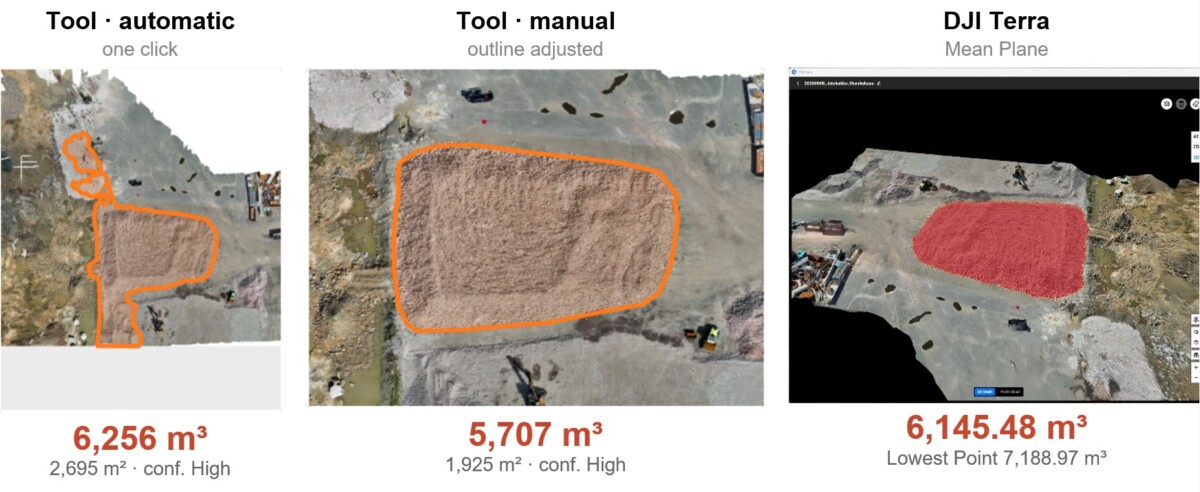
Picture 6. Shot 3: a cleanly separated pile. Both the automatic and the manual outlines bracket DJI Terra’s reference value, and the automatic result is within about two percent of it.
On a clean, well-separated pile the tool needs almost no help: the one-click automatic result (6,256 m³) sits within roughly two percent of DJI Terra’s 6,145.48 m³, and the manually tidied outline (5,707 m³) brackets it from the other side. Both were rated “High” confidence (Al-Naim 2026).
Why this matters
In this work we demonstrated the potential of photogrammetric model being a tool for measuring stockpile volume. Model was built based on set of aerial images that included metadata. Coordinates and flight height data can be adjusted to centimetre level accuracy with physical or virtual Real time Kinematic correction signal. Although this is not required if the demand of stockpile volume results accuracy is modest.
The point of the project was never a single clever measurement. It was to make the whole journey — from a muddy site visit, to a drone flight, to a finished picture — repeatable and checkable, so that anyone can see not only what the volume is but why it can be believed. Putting the tool side by side with an established package like DJI Terra is part of that: it shows where a single click is enough, and where a quick manual nudge brings the answer back in line (Al-Naim 2026). The full thesis describes the technical pipeline and the validation work in detail.
This work was carried out in Automaatio ja Tekoäly – Tiedoksi (AuToTIE) project (EAKR / Pohjois-Savon liitto, A80154) in collaboration with Jätekukko Oy
Videolinkki sovelluksen demonstraatioon.
Reference:
Al-Naim, M. (2026) Benchmark-aligned click-based stockpile detection in a 2.5D photogrammetric validation workflow. Bachelor’s thesis. Savonia University of Applied Sciences. Available at: https://www.theseus.fi/handle/10024/927571 (Accessed: 16 June 2026).



Authors
MD Al-Naim, Savonia University of Applied Sciences, Digicenter
Asmo Jakorinne, Savonia University of Applied Sciences, Digicenter