
Savonia Article Pro: IoT Data Collection – Interfacing with Commercial Building Monitoring Solutions, Part II
Savonia Article Pro is a collection of multidisciplinary Savonia expertise on various topics.
This work is licensed under CC BY-SA 4.0![]()
![]()
![]()
Introduction
During the course of the ÄLLITÄ project, the team has deployed various building monitoring solutions around the Savonia campus property in Varkaus. In our previous article on the topic, “IoT Data Collection – Interfacing with Commercial Building Monitoring Solutions, Part I”, we looked into connecting a specific district heating energy monitoring device to the Savonia data backend by using a low-cost Raspberry Pi-based Modbus TCP client. This time around we will discuss the process of integrating a number of third-party LoRaWAN air quality sensors to the data backend by means of the LoRaWAN gateway device that was deployed at the campus during our first sensor installation trip.
The Devices
The air quality sensors that were deployed are a product of Small Data Garden Ltd., namely the Iotsu L3. The AQ05 variant can measure indoor temperature, humidity and CO2 concentration, while the AQ01 variant can also measure the total concentration of volatile organic compounds (tVOC). These kinds of monitoring devices can be used to get an overview of the air quality in a given space, but also to estimate the amount of people in a room at a given time. This information can in turn be used to determine the overall usage level of a room over time and optimize parameters such as heating or ventilation accordingly. One such device is illustrated in Figure 1 below.
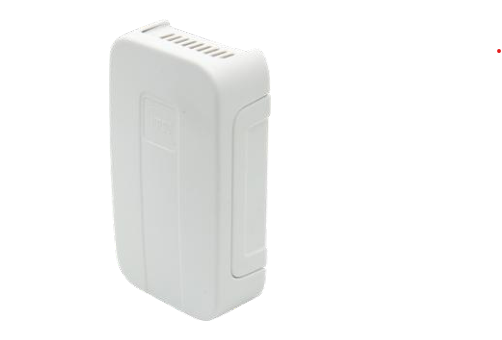
These Iotsu sensors are LoRaWAN-equipped, battery-operated devices that can function for up to 5 years on a single battery with the factory default configuration due to their low power requirements. Default transmission interval is 2 hours, and this can be adjusted using LoRaWAN downlink commands. During normal operation, the device performs 4 sets of measurements between transmissions, and since the shortest possible transmission interval is 10 minutes, the absolute minimum time between measurements is 2.5 minutes. This is sufficient for general monitoring of CO2 levels, since changes in total CO2 concentration don’t happen instantaneously.
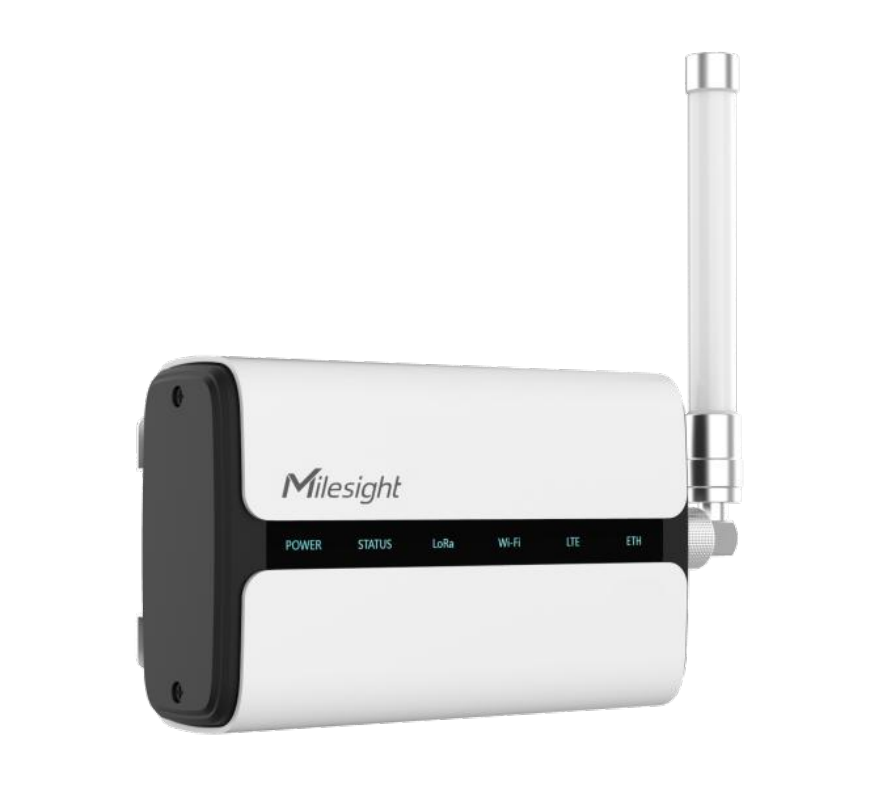
The LoRaWAN gateway device that was previously installed at the site is a Milesight UG65 which, unlike a very basic radio gateway, has many logic features already integrated. This means that the gateway can be used to handle device OTAA joins, sessions and even payload decoding and data forwarding via HTTP or MQTT. The gateway device can be seen in Figure 2 below.
The Plan
Since we already had the necessary gateway equipment deployed on the site, the setup was figured to go as follows:
- Configure the devices and data forwarding on the gateway
- Build and deploy an application server for payload decoding and further data handling
- Install the devices into selected locations on the site
- See the data flow.
We opted to not change the default configuration on the sensors at all, which means that we would be getting a transmission interval of 2 hours and, subsequently, a measurement interval of 30 minutes. This was determined to be a good balance between the project’s needs and sensor power consumption.
It was already known beforehand that some custom payload decoding would be needed at either the gateway device or the application server, and the gateway manufacturer itself practically only provides decoders for its own devices (running custom decoders is supported though). That said, neither official nor community-made decoders for the Iotsu L3 sensor payload could be found from public sources, so we had the honor of creating our own based on the specifications stated in the sensor data sheet.
The decision to have the payload decoder deployed in the backend instead of the gateway device was mostly about maintainability, since this would have the following benefits:
– No need to replicate the decoder on new gateways if the system is expanded later
– No vendor dependencies
– Easier logging and error handling (all in one place)
– Proper separation of concerns (gateway=transport, backend=logic).
The Set-Up
The sensors arrived from the reseller with a spreadsheet where the EUI numbers and app keys of the devices were listed. There was a total of 15 sensors to be installed, of which 13 were model AQ01 and 2 were model AQ05. The fact that two of the sensors were different was only noticed after the AQ01 model decoder was already up and running and the byte offsets didn’t quite add up when decoding messages from these two devices.
Nevertheless, the first thing to do was to append a planned installation location for each sensor into the list, simply to keep a record of where the sensors can be found afterwards (and possibly show the sensor data on a floorplan map later in real time).
Configuring the sensors on the gateway device was a rather straightforward process:
- Log into the web UI of the gateway device (obviously the IP and credentials should be known)
- Navigate to “Network Server” -> “Applications”
- Create a new application with a chosen name and description
- Add a “Data Transmission” option of type HTTP to the application, and set the URLs to point to the backend application server (“Uplink Data” URL being the important one)
- Hit “Save” and navigate to the “Device” tab
- Hit “Add” and fill out the required info for your first device (remember to select your newly created application in the “Application” dropdown)
- Repeat step 6 for the remaining devices
- Done.
At this point, the gateway device should be configured to forward all data from the added devices to the backend application server, with no further actions needed on the gateway side. Once the devices are installed to their designated locations and powered up, they should perform their OTAA join procedures, get connected to the LoRaWAN network and finally start their measurement-transmission cycles. HTTP requests arriving from the gateway device should now indeed be seen on the backend server, and they would look something like the one shown in Figure 3 below.
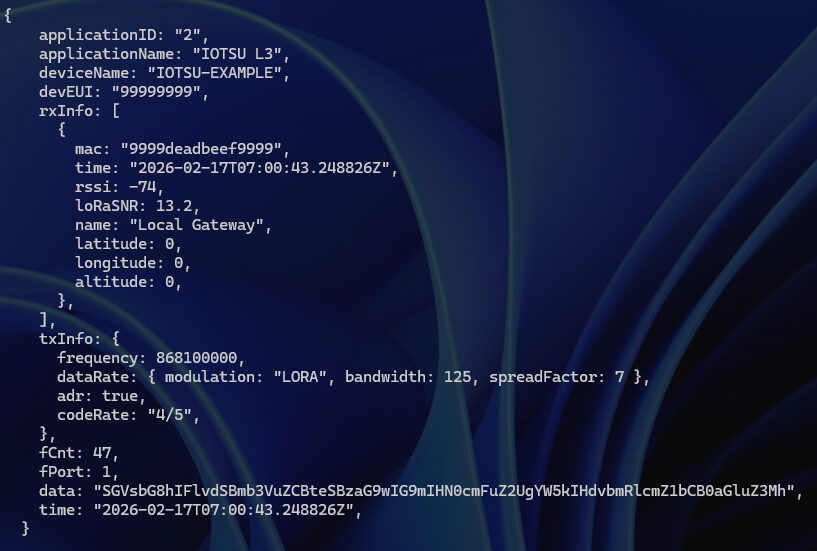
The HTTP request’s JSON body contains some basic information about the gateway application setup, and details of the sensor device and LoRaWAN network conditions. The most important things here would be the “time” and “data” fields, though. Frankly, the data payload is not exactly useful as is, since it’s base64-encoded binary, and this is where the payload decoder comes into play.
The Logic
Now that the data is in fact getting successfully sent to the backend server, the useful bits need to be extracted from the messages received. Speaking of bits, decoding the plain binary data requires some low-level data structure understanding and the ability to interpret the bit field chart that is included in the sensor manual. This was the largest and most involved part of the development work, and therefore it’s also discussed here in slightly greater detail.
The AQ01 model’s payload consists of 34 bytes (with data duplication enabled), and bit addressing is expressed in the chart as “B.b”, where the big “B” is the byte and the small “b” is the bit. For example, the first CO2 value is stored at location 4.0-4.7, which means that it consists of bits 0 through 7 of the fifth byte (these are zero-based). One important thing to note is that bit indexes in the manual are expressed with the most significant bit (MSb) as bit number 0, which might be counter-intuitive to software engineers especially when handling fields that are not 8 bits wide (there are also 1-bit and 9-bit fields).
The sensor manual includes an example payload that looks like follows (in hexadecimal): “B8506FF0391046F4353F2CEB328032CA30DE4EEC3B0548EE360148F1320248f33100”. There are 68 hexadecimal characters in the string, and since a pair of hexadecimal characters represents a single byte, the payload size is indeed 34 bytes. When these characters are converted to raw binary representation using, for example, the Linux utility “xxd” (hexdump tool), the underlying data would look like what can be seen in Figure 4 below.
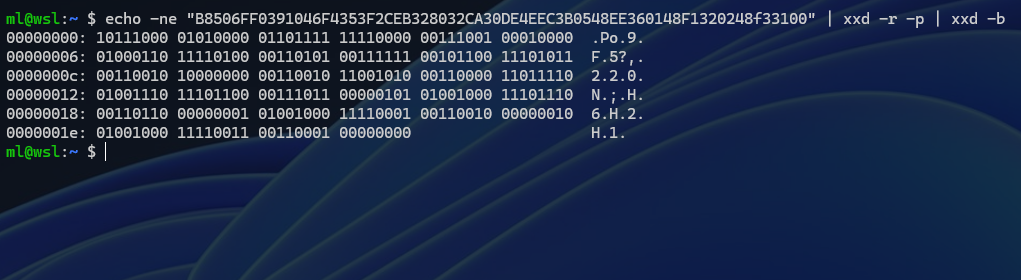
According to the sensor manual, the first byte (i.e. the first 8 bits) would contain the battery voltage of the device, and to get the actual voltage in millivolts, the value needs to be multiplied by 20. The binary number “10111000” translates to 184 in decimal, and that multiplied by 20 gives a value of 3680 millivolts, which sounds like a reasonable voltage value for a device that’s powered by a single Li-SOCl2 cell with a nominal voltage of 3.6 volts.
The second byte is an “info byte” that contains the configuration parameters of the device. The first 5 bits of this byte are flags (i.e. one-bit values), and to get the value of a single bit, the byte needs to be shifted to the right by the index of said bit and ANDed with a bitmask of 1. For example, the manual states that the “data duplication” flag would be the second bit of the second byte (i.e. bit 1.1 with the “B.b” convention), which means that the value of that flag can be obtained with the following operation:
data_dup = ((info_byte >> 6) & 1) == 1
The last “== 1” operation normalizes the result into a Boolean value (true/false), since the bit operation itself returns either a 1 or a 0.
As stated previously, the sensor manual uses an indexing scheme where the most significant bit (i.e. the leftmost bit) is bit number 0, which means that the “second bit” is actually bit number 6 when counted from the right (and starting from zero). Most programming languages treat the least significant bit (i.e. the rightmost bit) as bit number 0, and in this case, it might be clearer to use a full-byte mask instead of doing bit shifts. This means that the info byte would be ANDed with an 8-bit mask that’s otherwise all zeros but has a 1 at the place that’s second from the left. In this case such a mask would be “01000000” in binary, which translates to 64 in decimal, and the operation would then be as follows:
data_dup = info_byte & 64 != 0
The last “!= 0” operation is again used to normalize the result into a Boolean value, since the AND operation in itself returns either 64 or 0, based on whether the flag bit is 1 or 0, respectively.
The final 3 bits of the info byte (that’s 1.5 through 1.7 as per the “B.b” scheme) represent the transmission interval of the device. Since it’s 3 bits wide, it can have a value between 0 and 7, and this value would map to one of 8 pre-defined transmission intervals listed in the sensor manual (options range from 10 minutes to 12 hours). This 3-bit value can be read by ANDing it with an 8-bit mask that has 1s in all of the three indexes that make the value, i.e. the mask would be “00000111” in binary, and 7 in decimal.
The actual measurement values (temperature, CO2, humidity, tVOC) start from the third byte, and there are four sets of measurements per transmission interval (plus the previous four sets if data duplication is enabled). Each set of measurements consists of 4 values (and is 4 bytes wide in total), and these are divided as follows:
– humidity = bits 0 through 6 of the first measurement byte (2.0-2.6 as per “B.b”, MSb first, 7 bits in total)
– temperature = bit 7 of the first measurement byte and all bits of the second byte (2.7-3.7, 9 bits in total)
– CO2 = all bits of the third measurement byte (4.0-4.7, 8 bits)
– tVOC = all bits of the fourth measurement byte (5.0-5.7, 8 bits)
The extraction of the 7-bit and 9-bit values can be done by using bitmasks (while keeping in mind the indexing order) and AND operations as outlined previously, though extracting the 9-bit value involves reading two bytes in big-endian byte order and applying a bitmask of 511 decimal to the whole 16-bit block. Both 8-bit values can be read as is, just like the battery voltage value discussed previously, and all values are treated as unsigned integers since there are no parameters that could have a value less than 0 (temperature would be one, but the stated measurement range of the device goes from 0 to +50 degrees Celsius). Finally, most of the values have a scaling formula that needs to be applied to the raw value to get the final value, and these can be found in the sensor manual.
One thing to note is that the sensor devices don’t have any idea about the current date and time, which means that timestamps need to be created on the gateway side as the messages arrive. Since the device has a transmission interval of 2 hours and every interval consists of 4 sets of measurements, the timestamps need to be calculated by “cumulatively subtracting” the time between measurements (30 minutes in this case) from the arrival time for every set of measurements. Since the manual also states that oldest data comes first and the values are sampled at the end of each measurement period, the timestamps for each of the four sets of measurements would be as follows (T = arrival time):
– First set (starts at 2.0 “B.b”): T – 3 x 30min
– Second set (starts at 6.0): T – 2 x 30min
– Third set (starts at 10.0): T – 30min
– Fourth set (starts at 14.0): T
If data duplication is enabled, the last 16 bytes of the data would contain the 4 sets of measurements from the previous transmission interval, which means that the timestamps for those can be calculated according to the above, but with the whole transmission interval (2 hours) further subtracted from each set. The idea of data duplication is that it makes it possible to catch earlier measurement values if a previous transmission failed for any reason.
The Application
The app that was crafted to do all of this is a NodeJS program that consists of an HTTP server (express) for receiving messages from the LoRaWAN gateway, a decoder for extracting data from the messages, a message formatter for constructing JSON messages that the Savonia data backend can understand, and an HTTP client for sending those messages to the data backend (which is a Thingsboard PE instance). The configuration of the app consists of an array of key-value pairs that map the EUI numbers of the sensors to device entries that were created in the data backend ahead of time. Since the data backend is a Thingsboard instance, each device configured there would have a private HTTP POST endpoint for receiving JSON-formatted data, and this makes it quite easy to manually “provision” arbitrary devices.
There are in fact two decoders in the app because, as stated before, two of the sensors were model AQ05 instead of AQ01. The only meaningful difference between these models is that the AQ05 doesn’t measure tVOC and thus has a smaller payload size (and different byte offsets by extension), and the second decoder is just a slightly modified version of the first. Nevertheless, the overall logic of the application is as follows:
- Listen for HTTP messages from the gateway
- Once a message is received, check its data payload size and select the decoder accordingly
- Decode and calculate values from the payload as outlined earlier
- Calculate and append timestamps to the measurements (time of arrival at the gateway is included in the incoming HTTP request, as seen in Figure 3)
- Get the correct Thingsboard device identifier based on EUI
- Send the formatted data message to the device’s HTTP POST endpoint on Thingsboard.
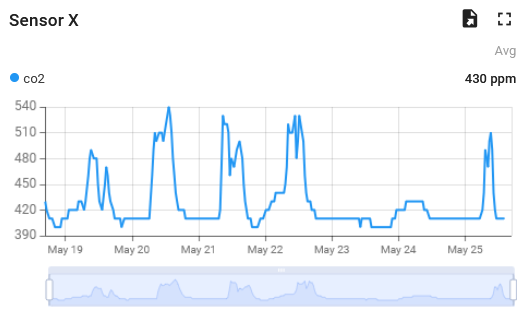
The outgoing HTTP requests are formatted according to the Thingsboard specification, but could easily be adapted to work with other data backends. Once the data is in its final destination, it can be visualized with Thingsboard’s dashboarding features like seen in Figure 5 below.
The Conclusion
The sensor integration process outlined in this article consisted of a healthy mix of low-level IoT engineering, server-side web development, unfamiliar device specifications and physical device installations. Most of the information presented here is somewhat basic knowledge and might seem a bit (heh) unappealing to most, but there are times when someone could benefit from a rather detailed description of how these foundational concepts can be put into practice.
Regarding the ÄLLITÄ project and its focus on AI tools, data analysis, prediction models and advanced building automation, most of the work presented here would belong in the “data generation layer” of these kinds of systems. To be fair, having such advanced systems in place would provide very little value if there was no data for them to work on.
Authors
Mika Leskinen, RDI Specialist, DigiCenter, Savonia University of Applied Sciences, mika.leskinen@savonia.fi
Aki Happonen, Digital Development Manager, DigiCenter, Savonia University of Applied Sciences, aki.happonen@savonia.fi
Laura Leppänen, RDI Specialist, Savonia University of Applied Sciences, laura.leppanen@savonia.fi
Shahbaz Baig, RDI Specialist, DigiCenter, Savonia University of Applied Sciences, shahbaz.baig@savonia.fi
References
Small Data Garden Ltd., 2017. Manual – IOTSU AQ Combo for LoRaWAN. Available at: https://smalldatagarden.com/wp-content/uploads/2025/06/EN_IOTSU_L3_AQ05_Manual_v1-4.pdf
Xiamen Milesight IoT Co., Ltd., 2026. Data Sheet – Semi-Industrial LoRaWAN Gateway UG65. Available at: https://resource.milesight.com/milesight/iot/document/ug65-datasheet-en.pdf