
Savonia Article Pro: Performance-focused machine capacity simulation – part 2: Simulation description
Savonia Article Pro is a collection of multidisciplinary Savonia expertise on various topics.
This work is licensed under CC BY-SA 4.0![]()
![]()
![]()
The following article explains the simulation models in high-mix, low-volume Small and Medium-sized Enterprises (SMEs), which often face challenges such as limited operations capacity, fluctuating order volumes, variable setup durations, and varied customer demands, causing significant delays in their order delivery to their customers.
Designing simulations for such environments is complex and costly due to extensive data requirements so this this model has focused on the main bottleneck workstation, which this approach aligns Theory of Constraints (TOC), emphasizing the management of the system’s primary bottleneck, and simulation studies have shown that focusing on such constraints often significantly improves throughput and resource utilization (Golmohammadi, 2015; Gundogar, Sari, and Kokcam, 2016).
The developed simulation evaluates scenarios like customer prioritization and job sequencing, measuring KPIs such as lead time, queue length, and throughput. The goal of this model is to give actionable insights into how SMEs can align their capacity planning strategies with customer expectations, reduce delays, and optimize resource utilization.
Input Data
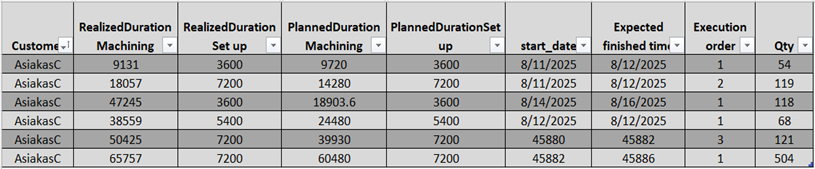
1. Database: To run the simulation, a structured database is one of the essential parts. In this case, the database needs to include production behaviour and timing relationships. The dataset included this information:
– Customer ID
– Actual machining and setup durations
– Planned machining and setup times
– Start date and expected finish time
– Execution order or job priority
2. Configuration layer : The configuration layer is a key part of the simulation, allowing users to adjust parameters such as time mode (planned vs. actual), shift patterns, resource allocation, failure and maintenance settings, quality rates, and setup optimization. This gives a range of options to the user to evaluate scenarios under different conditions. Figure 1 shows the model configuration tab.
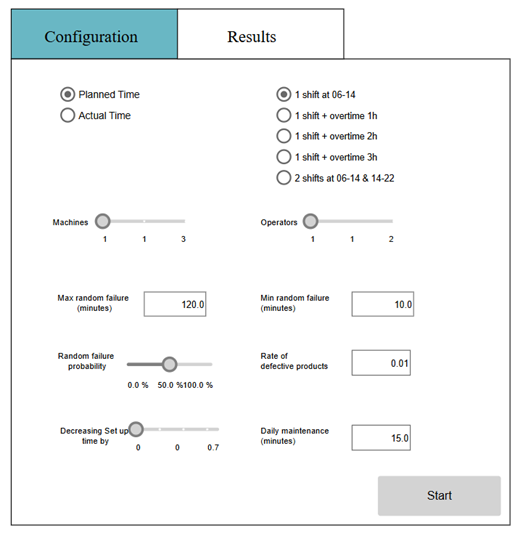
Users can adjust key parameters to test different scenarios. Time mode lets you choose between planned or actual data for performance comparison. Shift settings include regular (06:00–14:00), overtime, or two-shift setups. Resource allocation adjusts machine (1–3) and operator (1–2) capacity. Failure and maintenance settings define breakdown probability, duration, and daily maintenance time to simulate real-world disruptions. Finally, quality and setup options allow setting defect rates and reducing setup time to model process improvements.
Simulation level
The model was constructed using components from the Process Modelling Library, such as Source, Queue, seize–Delay–Release, and Sink blocks. Figure 2 depicts the simulation process, and following each element application will be explained in detail.
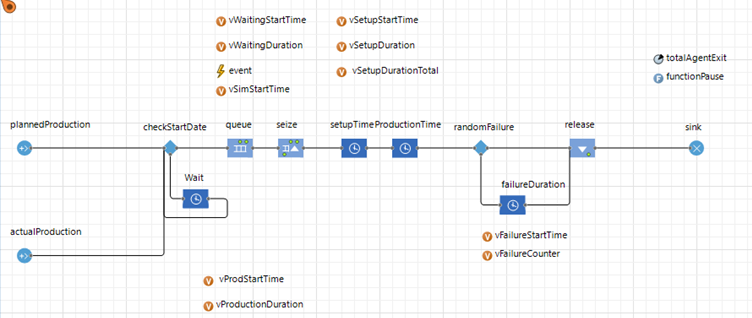
Data Source (PlannedProduction / ActualProduction): The jobs data sources release agents from plannedProduction or actualProduction, depending on the user’s choice. Each job (agent) represents a production order and carries information regarding its customer, priority, and time requirements. This feature helps planners compare actual performance against plans, identify deviations, and test adjustments such as shift changes or setup reductions. Data is linked to an external Excel interface, enabling easy updates from ERP systems and continuous performance evaluation without altering the model structure.
CheckStartDate and Wait Block: The checkStartDate block acts as a control gate, releasing jobs only when their scheduled start time matches the simulation clock. This ensures production orders follow the planned sequence and allows planners to analyze how early or delayed releases affect downstream performance.
The Queue and Seize blocks manage resource allocation and job sequencing. Jobs are first sorted in the Queue based on priority rules (e.g., Shortest Processing Time), then move to the Seize block, where processing begins only when both machine and operator are available. This setup mirrors real-world conditions where multiple orders compete for shared resources.
SetupTime, ProductionTime, and RandomFailure Blocks (Processing Stage)
SetupTime, ProductionTime, and RandomFailure blocks are core processing components in which the production happens. In the SetupTime block, jobs undergo preparation before machining, with durations based on planned or actual data. ProductionTime represents the machining phase, using parameters from the database.
The subsequent block is Production time, representing the machining stage of the workstation. When the agent enters this block, the machining process, which is defined by DurationMachining from the database.
The RandomFailure block simulates breakdowns by applying user-defined failure probability and duration ranges. If a failure occurs, the job pauses for a random time before continuing, replicating real-world downtime and its impact on production flow.
Release and Sink (Completion and Data Collection): The Release and Sink blocks are the final stages of the simulation. After machining, the Release block frees resources for the next job, ensuring continuous flow and updating key variables like failure time, maintenance time, and resource utilization, which are critical for calculating metrics such as OEE. The Sink block then completes the job and collects performance data, including throughput, scrap count, and efficiency ratios, storing them for visualization in the results dashboard. Once all jobs finish, the system pauses and consolidates data on setup time, production duration, waiting time, and queue time, presenting real-time metrics for decision-making. This stage mirrors real-world reporting, enabling planners to review performance and assess the impact of operational changes.
Result Tab and Metrics Explanation
After completing the calculations in the final phase, the Results tab displays the main output data generated by the simulation model (Table 2). The take includes configuration and metrics together in the result tab.
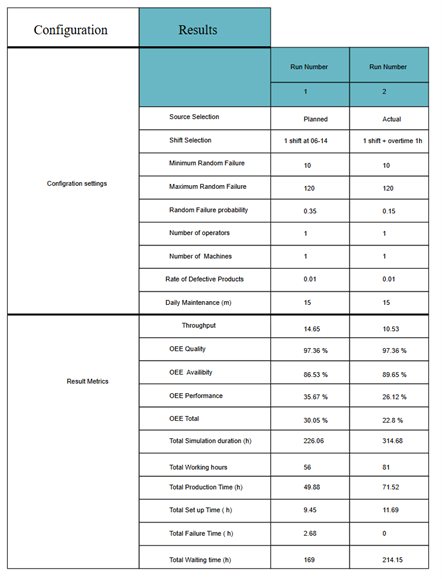
The second part of the results table shows performance metrics. Throughput measures completed jobs, while Overall Equipment Effectiveness (OEE) evaluates efficiency through three components:
– Availability: proportion of scheduled time equipment runs
– Performance: operating speed vs. maximum speed
– Quality: percentage of good units produced
These combine OEE Total, a key efficiency indicator. Additional time-based metrics include Total Simulation Duration, Working Hours, Production Time, Setup Time, Failure Time, and Waiting Time. Together, these metrics reveal where time is spent and highlight bottlenecks, making it easier to assess how factors like shift length, machine reliability, or resource levels impact productivity.
This article is made as part of Simulation models in industrial processes project. You can read more about project from here: https://sitepro.savonia.fi/ . The first and third parts of the article can be accessed here:
Performance-focused machine capacity simulation – part 1: Introduction
Performance-focused machine capacity simulation – part 3: Example scenarios and benefits
Writer:
Sorayya Amirahmadi, Project Specialist, Savonia University of Applied Sciences
References:
Golmohammadi, D. (2015) ‘A study of scheduling under the theory of constraints’, International Journal of Production Economics, 165, pp. 38–50. https://doi.org/10.1016/j.ijpe.2015.03.015
Gundogar, E., Sari, M. and Kokcam, A.H. (2016) ‘Dynamic bottleneck elimination in mattress manufacturing line using theory of constraints’, SpringerPlus, 5, p. 1276. https://doi.org/10.1186/s40064-016-2947-1.