
Savonia Article Pro: Sustainable Manufacturing Decisions with Simulation: Part 2
Savonia Article Pro is a collection of multidisciplinary Savonia expertise on various topics
This work is licensed under CC BY-SA 4.0![]()
![]()
![]()
Computer-Based Model
Configuration Frame
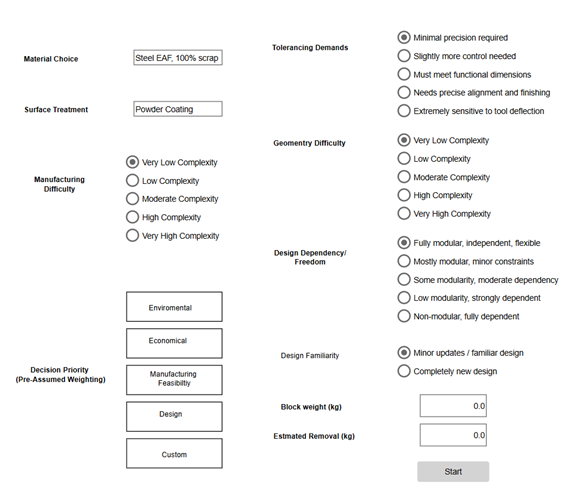
The first interface (figure 2) represents the first frame of the simulation model. In this frame, the user defines the initial parameters that influence the environmental and manufacturing evaluation of a product. The purpose of this interface is to collect key design, material, and manufacturing information that will later be used by the decision-making and carbon footprint calculation model.
The first step is to select the material type and surface treatment, which influence the environmental footprint of the product because different materials and treatments have different embodied emissions and processing requirements. For example, choosing a material such as steel affects the estimated material-related CO₂ emissions.
Next, the interface allows the user to define the manufacturing difficulty and tolerancing demands. These parameters describe how demanding the production process will be. Higher tolerancing requirements or manufacturing difficulty typically require more precise machining, specialized tooling, or additional processing steps, which can increase energy consumption, processing time, and cost.
The geometry difficulty parameter describes how complex the part geometry is from a manufacturing perspective. More complex geometries often require advanced machining operations, additional setups, or specialized tools, which can increase both production effort and environmental impact.
The design dependency or freedom parameter evaluates how modular or interdependent the design is. A fully modular design allows more flexibility in manufacturing and material selection, whereas highly dependent designs may restrict process choices and increase complexity.
Another parameter is design familiarity, which indicates whether the product is a well-known design with minor updates or a completely new concept. Familiar designs usually involve less uncertainty and lower manufacturing risk, while new designs may require more experimentation, process adjustments, and development effort.
The interface also allows the user to select the decision priority through pre-assumed weighting. By selecting options such as Environmental, Economical, Manufacturing Feasibility, or Design, the model automatically adjusts the weighting of the decision criteria to reflect the chosen strategic focus. In addition to this, by clicking on custom, the window automatically changes to a scoring frame, so the scoring can be adjusted based on user preference.
Finally, the user enters the block weight and estimated material removal values. These parameters describe the initial raw material mass and the amount of material expected to be removed during machining. This information is important for estimating material usage, waste generation, and the resulting carbon footprint.
Once all inputs are defined, the Start button initiates the simulation. The model then processes the provided inputs using the predefined criteria, weights, and emission calculations to evaluate the environmental and manufacturing performance of the selected design and process configuration.
Scoring Frame
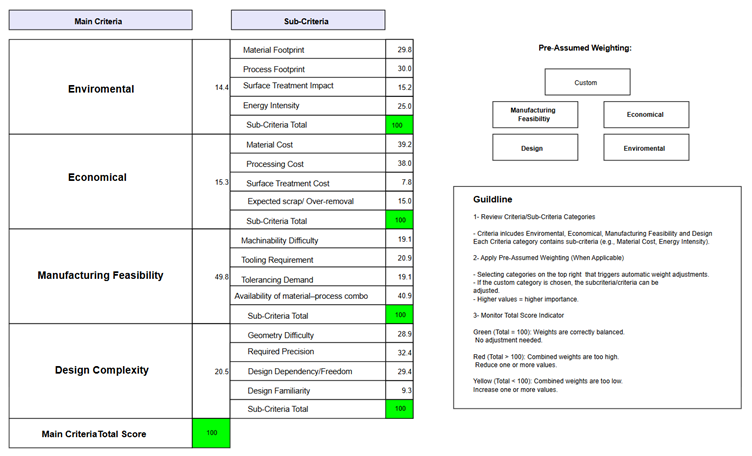
By clicking on custom, a new frame (figure 2) appears, which illustrates the Hierarchical Decision Process (AHP) scoring table. This is used to evaluate manufacturing and design options based on Environmental, Economic, Manufacturing feasibility, and design complexity. The structure is divided into main criteria and sub-criteria, each with assigned weights that represent their relative importance in the evaluation.
At the top level, the model contains four main criteria: Environmental, Economic, Manufacturing Feasibility, and Design Complexity. The weights of these four criteria sum to 100, meaning they represent the total importance in the final decision score. Each percentage shows how much influence that category has in the overall evaluation. Within each main criterion, several sub-criteria are defined to break the category into more specific measurable factors. The weights of the sub-criteria within each category also sum to 100, but these values are relative only to their corresponding main criterion, not to the overall model.
Result Frame
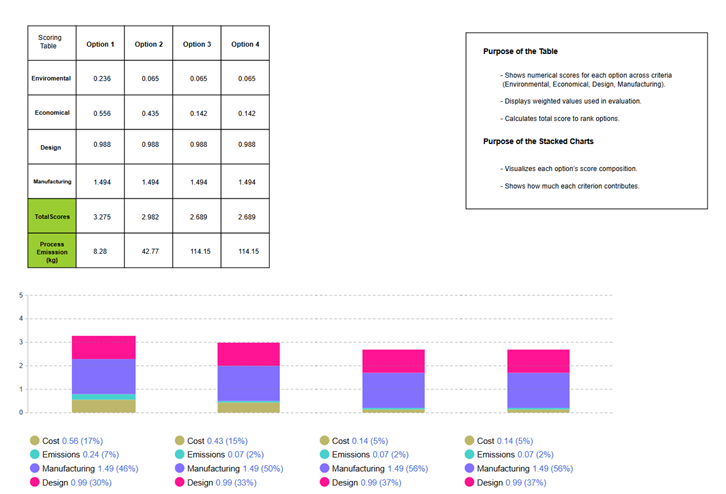
As soon as use click on the start button, the second simulation window appears (Figure 3) that demonstrates the evaluation results that were generated from the user’s input parameters. The purpose of this screen is to communicate how each option performs across four major dimensions, such as Environmental, Economic, Design, and Manufacturing.
On the left, the scoring table provides the numerical results for each option. Each row represents one evaluation criterion, showing how strongly that criterion contributes to the overall performance of the option based on the weighting selected earlier. These values represent weighted scores rather than raw measurements, meaning the model has already adjusted them according to the user’s decision priority (such as Environmental or Economic focus).
The table also includes a “Total Scores” row, which sums up the weighted criteria for each option. This total score forms the basis for ranking the alternatives: higher totals indicate better alignment with the chosen priorities. Beneath the total score row, the “Process Emissions” row displays the calculated CO₂ emissions associated with the manufacturing processes of each option, expressed in kilograms. This provides an additional layer of insight by linking performance to sustainability outcomes.
The bottom section of the window displays the stacked stack charts for each option. Each chart breaks down the overall score into colored segments that correspond to the four evaluation criteria. By visualizing the proportion of cost, emissions, manufacturing, and design contributions, the charts help users identify the impact of each criterion for each option. For example, one option may have a high total score and a strong manufacturing contribution, while another may achieve its score mainly through design performance or cost efficiency. The combination of graphical representation and the numerical table offers a more intuitive way to assess differences between options.
Overall, this window translates the input parameters from the first stage into clear, comparable results. It allows users to evaluate not only the final scores but also the underlying structure of each option’s performance and environmental impact.
This article and simulation model were made as a part of the EU partly funded Simulation models in industrial processes project. The simulation model is made by Anylogic software, and it can be viewed in Anylogic cloud: https://cloud.anylogic.com/model/71d2442f-0011-4b95-9047-c6e674077c3a
This article is made as part of the Simulation models in industrial processes project. You can read more about the project from here: https://sitepro.savonia.fi/ . The first part of the article can be accessed here:
https://www.savonia.fi/en/articles-pro/sustainable-manufacturing-decisions-with-simulation-part-1/
Author
Sorayya Amirahmadi, Project Specialist, Savonia University of Applied Sciences