
Savonia Article Pro: Performance-focused machine capacity simulation – Part 3: Example scenarios and benefits
Savonia Article Pro is a collection of multidisciplinary Savonia expertise on various topics.
This work is licensed under CC BY-SA 4.0![]()
![]()
![]()
Effective scenario testing is essential for exploring how various operational choices influence system performance in a simulation model. This helps managers and planners in making more data-driven decisions that improve efficiency, reduce delays, and optimize resource utilization. Video 1 demonstrates an example of how simulation can be executed for structured scenario testing.
Example Scenario
To provide a clear basis for interpreting the model’s behaviour, four experimental configurations were created. Instead of using a single baseline, the scenarios compare two data sources (Planned vs. Actual production data) combined with two shift structures (regular shift and regular shift with one hour of overtime).
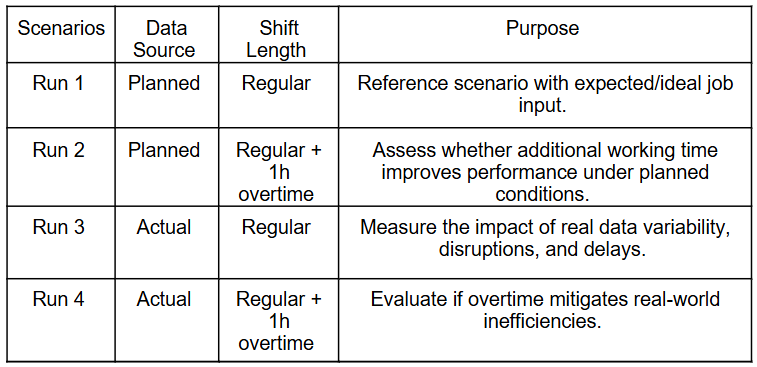
As it has been shown in the above table, the experiment was divided into 4 different configurations, as different sources (planned versus actual database) and two shift lengths (regular shift (06:00–14:00) and regular shift with 1 hour of overtime). Also, runs 1 and 2 were generated with the planned source, which represents the expected production with predefined job sequences and stable input values. However, running two additional 1 hour of overtime has been considered, so this scenario also considers how extending one shift can impact the metrics. Conversely, runs 3 and 4 used Actual data that considers the real data production with unplanned delays. The difference between these two runs is that the 4th proceeds with 1 hour of extra time in daily production.
Considering other parameters such as random failure probability (0.5), maintenance duration (15 minutes), and defect rate (0.01) stayed the same. The main reason for this was to ensure that the executed performance variations only resulted from the differences in shift duration and data source (planned vs. actual) rather than from any change in failure or maintenance conditions. Table 2 shows the result tab from simulation Runs in the FIFO scenario.
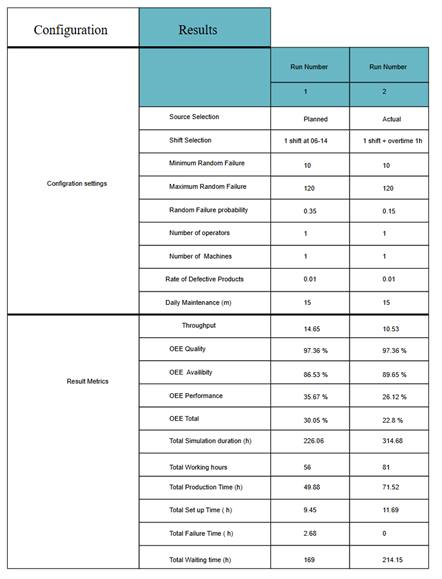
The results from this group show how different data sources and working hours influence the production line’s performance with the FIFO scheduling rule. Looking at the Planned data (Runs 1–2), it is visible that the configurations achieved higher throughput and OEE than those using Actual data (Runs 3–4), incorporating unplanned delays. In planned runs, throughput values were 11.5 and 10.62 units, whereas the Actual runs achieved only 7.07 and 7.75 units, showing about a 30–40% reduction in output under real conditions. Furthermore, OEE Performance and Total OEE dropped from 25.97% and 23.91% in the planned cases to 21.84% and 18.0% in the actual ones, which shows that the machine utilization and process flow were less efficient in real production.
Considering time-based metrics (e.g., Total setup time) to determine how total working hours available are being utilized and where inefficiencies happen in the systems. With a quick look at the table, it is observable that the total waiting time in all the runs accounted for most of the total simulation duration, while actual processing and setup times were much shorter, which suggests that products spent a considerable amount of time in the queue ( Total waiting time has been considered non-working hours and weekend).
Additionally, extending the working time by one extra hour (Runs 2 and 4) has slightly impacted the throughput or OEE. This means that the constraints are the primary barrier to workflow coordination rather than in available working time. This result demonstrates that improving job sequencing and reducing idle times will yield more performance improvements than adding hours to shifts or maintaining optimized scheduling input.
Managerial Implications and Practical Benefits for Companies
The developed simulation model and the operational framework can serve as a decision-support tool to enhance operational and strategic planning and improve collaboration across supply networks. To elaborate, having the simulation as a tool helps planners to have a better perspective on anticipating how each decision can impact the key metrics at the end. For example, it helps to understand how adjustments to orders, resource adjustments, or shift extensions affect production, throughput, and OEE before implementing them in real production.
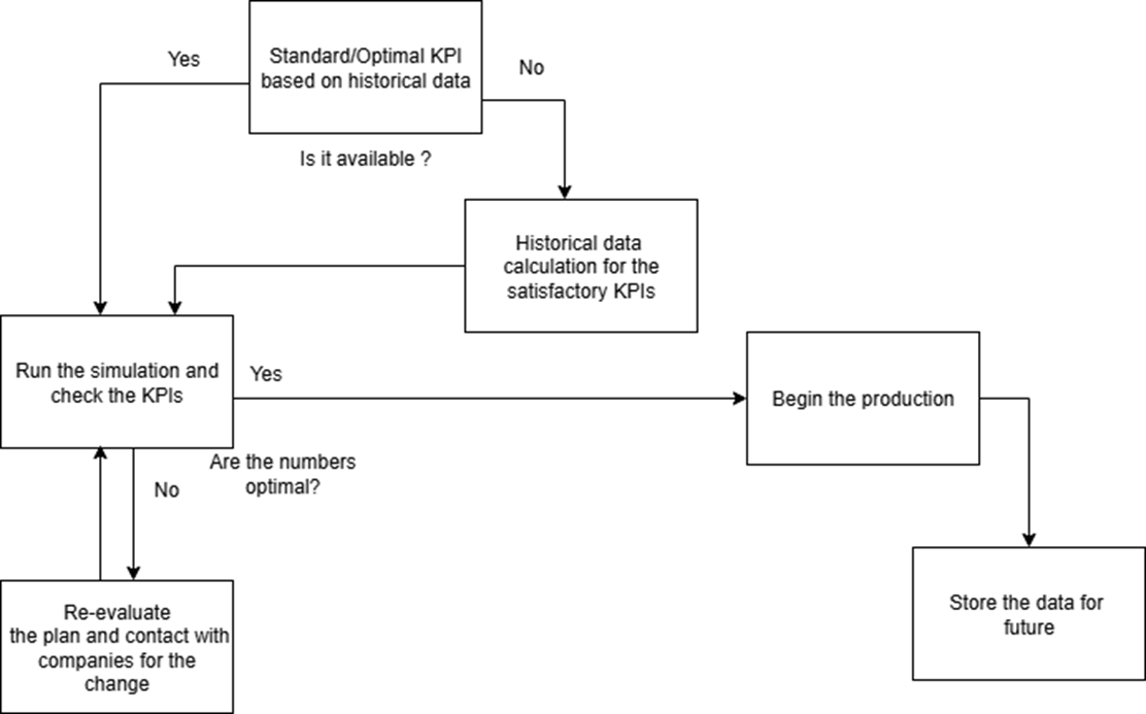
having said that, the Metrics such as throughput, production, and queue time are not unique for each industry, so planners may not have an optimal target when they run the simulation. Figure 1 shows how production planners can use the simulation for better decision-making.
Furthermore, the model provides scalability and accessibility for SMEs. Even though they might not have an extensive database or an advanced IT infrastructure, they will be able to benefit from simulation modelling. By studying the bottleneck workstation, SMEs can still obtain valuable insights into their production performance to support their capacity planning decisions.
Additionally, the model also takes the common challenge of SMEs serving multiple customers into consideration, allowing firms to test different prioritization rules such as FIFO, shortest processing time, or key customer. This helps firms align operational decisions with strategic goals, improving both customer satisfaction and long-term partnerships.
Lastly, simulation promotes collaborative planning and transparency by serving as a shared visualization tool that strengthens communication within and between companies. To clarify, when managers and planners can visualize capacity constraints, bottlenecks, and the impact of different scheduling decisions, they gain a shared understanding of the system’s real limitations. This shared visibility enables data-driven discussions by allowing stakeholders to align their expectations, reduce conflicts caused by unrealistic delivery commitments, and collaboratively develop more feasible production plans.
This article is made as part of Simulation models in industrial processes project. You can read more about project from here: https://sitepro.savonia.fi/ . The first and second parts of the article can be accessed here:
Performance-focused machine capacity simulation – part 1: Introduction
Performance-focused machine capacity simulation – part 2: Simulation description
Author:
Sorayya Amirahmadi, Project Specialist, Savonia University of Applied Sciences
References:
Goldratt, E.M. & Cox, J., 1984. The Goal: A Process of Ongoing Improvement. Croton-on-Hudson, NY: North River Press.