Savonia Article: Developing a Secured Software Frontend, Backend and Analysis Dashboard for Sensor’s Data Visualization
#SavoniaUAS
Abstract:
The project was created to visualize the real-time data coming from sensors. It consisted of three Phases The frontend, The backend, and the microcontroller.
The front end provided an interface for users to visualize data, retrieve data, and IoT systems. In contrast, the microcontrollers, like Arduino Uno, were responsible for retrieving data from the sensors and passing it to the backend, the key player here, which had APIs written algorithms to manipulate what to do with data, such as what kind of data to be sent to frontend, what to do with the data, how to manage the data, how to handle the user sessions logging in and out, addressing privileges to admin and student, sending email as notification for critical circumstances, etc. the backend took this kind of logic and many more.
The technology used in the project was the famous MERN stack, M for Mongo dB, which was the document-based database where all the primary data were stored. E for express is a framework that allows us to write server-side code using JavaScript; R for React, a JavaScript frontend framework and N node.js, a JavaScript runtime environment that allows running JavaScript code in our computer.
Keywords: Secured Software; MERN Stack; Mongo Database; Sensor’s data visualization; Arduino Uno; Software Dashboard
1. Introduction
As the world is advancing in technologies, it gives developers new opportunities to create something unique, and this is how this project came into motion to test out how we can create software that is in sync with the hardware to build an IoT system where the software would be the layer which would make the systems use extremely easy for the users.
The project’s primary goal was to create a front end showing a bunch of sensor data like temperature, humidity, and intrusion detection features. However, as the project progressed, many ideas were put on the table, but with the limited time duration and only some of the skills required would be readily available, some were decided to be implemented, and some were shortlisted as possibilities for the future addition.
2. The Frontend
The front end was written using a javascript react library that allowed the user to log in to the system, Visualize the data, and manipulate the system.
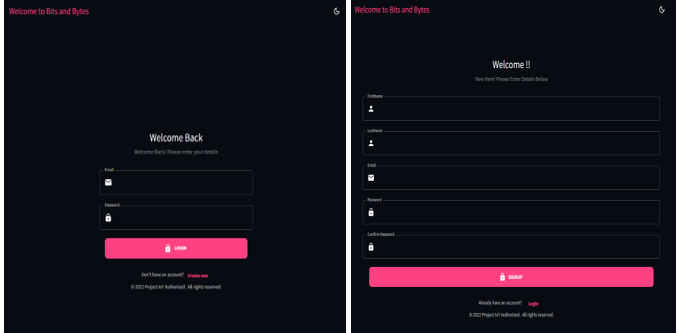
Figure 1: Interface For the user to enter the system.
The interface is for the users to get into the system if they have not created an account, and once they have successfully authenticated, they are redirected to the dashboard page.
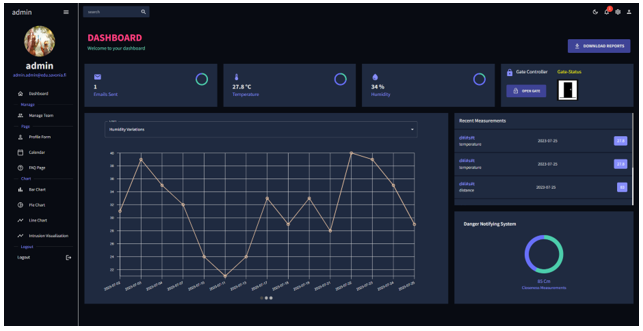
2.1 Dashboard
The Dashboard is responsible for displaying essential data such as temperature, humidity, how many emails were sent, control microcontrollers, showing intrusion status, Recent measurements, different charts and graphs of data, and features to download data.
Figure 2: The Dashboard
Reference link: Edroh
Above in the dashboard, the data like temperature, humidity, Intrusion, notifications, and recent measurements are sent over sockets, making it real-time. The application is also designed to render on the access level, i.e., the admin and the students might have slightly different interfaces. The download feature allows the client to download the data in CSV form, which can be used later.
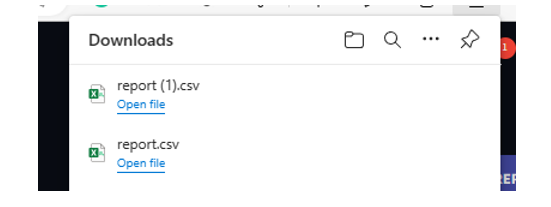
Figure 3: The Download feature
2.2 The Charts
The different types of charts were used for better analysis of data, such as bar charts, line charts, and pie charts that depicted additional data such as temperatures, distances, emails sent, and humidity variations over some time.
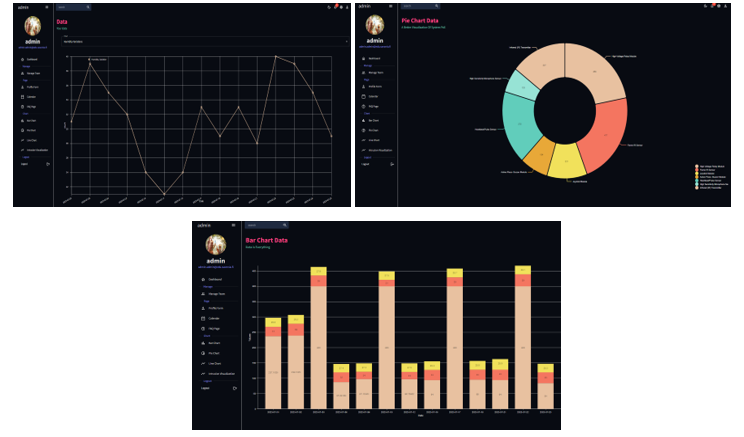
Figure 4: Charts
2.3 Admin Access
The software also provides rendering based on access level, i.e., only the admin is capable of a few features, such as creating and updating users for the system, and those features are only available to the admin
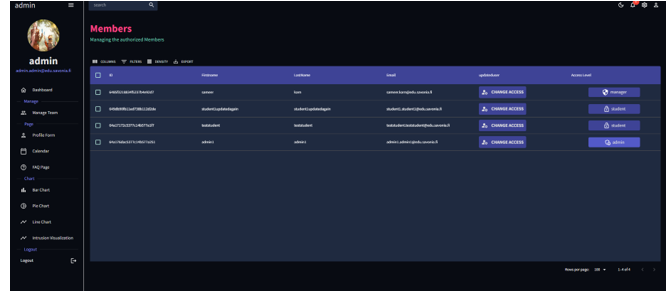
Figure 5: Update User
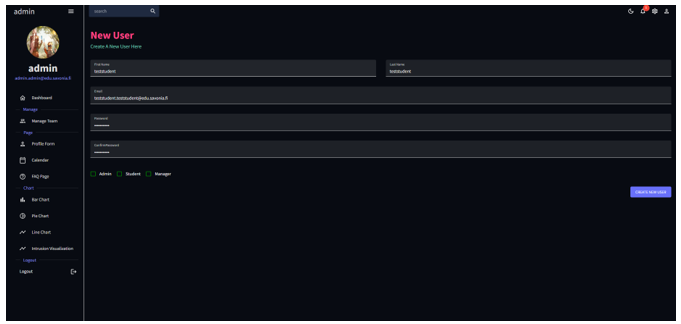
Figure 6: Create a new user.
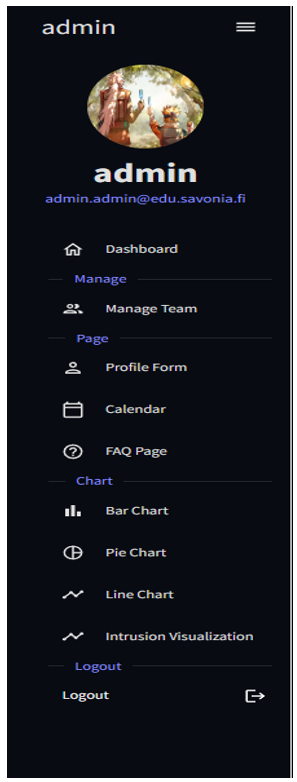
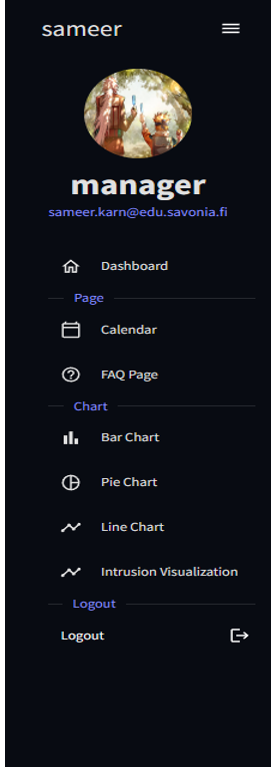
Figure 7.1: Admin-based Rendering Figure 7.2: Student-Based Rendering
2.4 IoT System Interface
In the dashboard, we have something like a gate controller, which, under the hood, is a prototype represented by the servo motor that allows the user to control how the IoT systems components work. The project was depicted using a simple example of complicated IoT systems and their controls over the software.
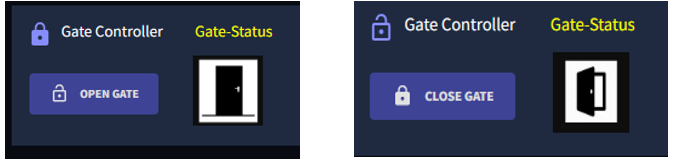
Figure 8: IoT system Control
3. The Backend
The Backend was the key player in the project as it did the heavy lifting. It was responsible for the reliable and fast transfer of data written in JavaScript using Express framework and the node.js, a JavaScript runtime environment. The task of the backend was to handle incoming requests, manage the database, retrieve sensor data from the microcontroller, send commands to the microcontroller, send emails for crucial information as notifications, and handle real-time communication.
The backend was also responsible for automatically scheduling tasks that would store the data, calculated based on an algorithm to save to the database daily.
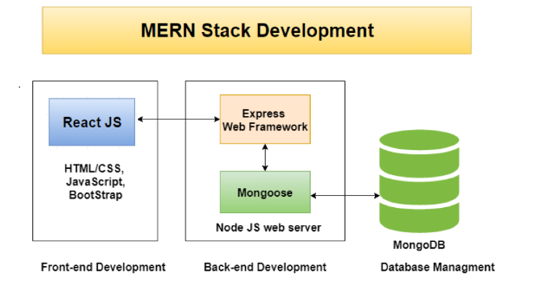
Figure 9: MERN Stack, Reference Image Link: google
3.1 Handle Incoming requests
The APIs were written to handle incoming requests of users that allowed them to log into the system, access database data, modify data, and many other essential features. The backend was also responsible for handling the necessary and validating incoming requests for admins and students and serving them based on their access level.
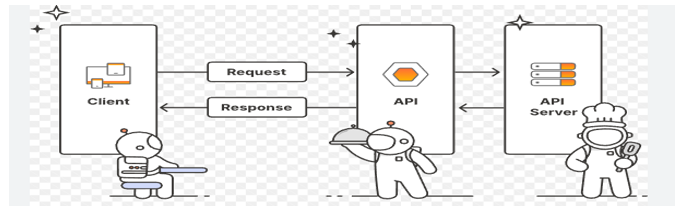
Figure 10: APIs, Reference Image Link: APIs
3.2 Manage Database
The backend’s other vital role was managing the database, where the critical sensor and user data were stored. For that purpose, a highly famous document-based database MongoDB was chosen.
The Database was cloud-based, and with the free feature, it had some limitations on how much data was allowed to be stored on the cloud; however, for the prototype, it was more than enough.
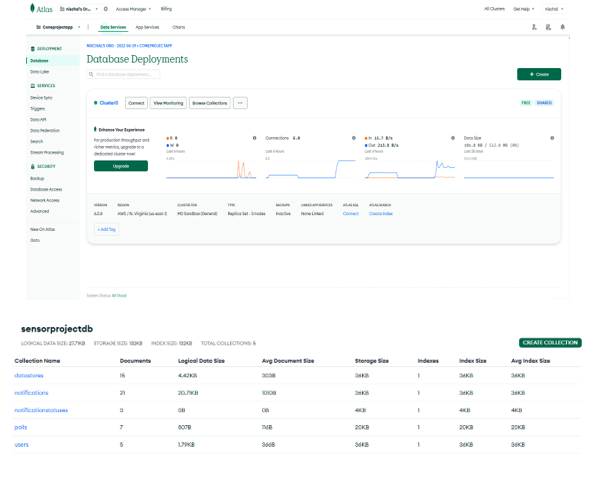
Figure 11: Mongo DB Atlas
3.3 Microcontroller Integration
The somewhat tricky part was how to integrate the microcontrollers with the backend to create a flow of data from the microcontroller to our node.js applications, for which a bunch of different libraries were used that not only allowed our backend to retrieve data but also sent commands via serial connection.
3.4 Real-Time communication
The backend’s other important job was to take the data and send it to the client in real-time with extremely low latency, which was achieved using a library called socket.io which is built over web sockets that are full-duplex and bidirectional protocols that would persist between the client and the server allowing for that data flow to in real-time.
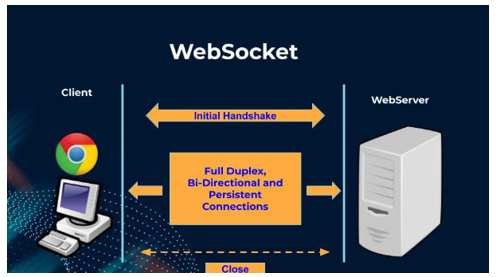
Figure 12: Web-Sockets working design.
Reference link: WebSocket’s
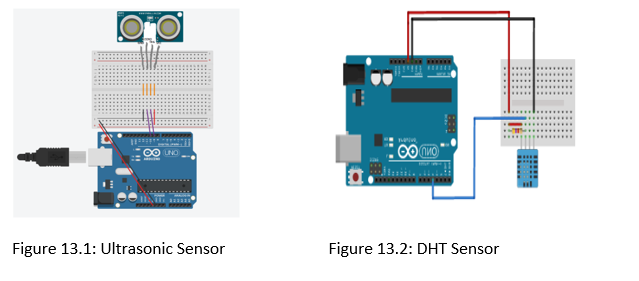
4 MicroController
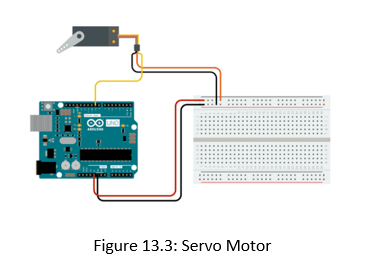
The final essential piece is the microcontrollers; the embedded systems were programmed in C/C++ in such a way as to transmit different sensor data such as temperature, humidity, and HC-SR04 over serial communication and also to control servo motors.
In the project, there were two microcontrollers used, one which was solely responsible for retrieving sensor data and the other which depicted IoT systems; the reason behind it was, for some reason, the servo motors could suddenly cause spikes which would lead to the inconsistent reading of HC-SR04 sensor which was here to represent the prototype of intrusion.
The system also has a led system that blinks extremely fast if someone gets too close to the system.
Reference Link Source:
The Prototypes were to demonstrate how the IoT systems could be controlled via software, here the servomotor acts as the gate, as mentioned above, and the ultrasonic sensor acts as the intrusion system, which later can be replaced with better technology; the beauty here is that it hides the underlying complexity of the controls and provides users with simple access control.
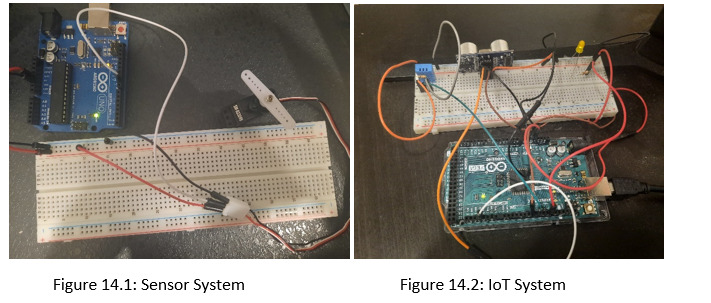
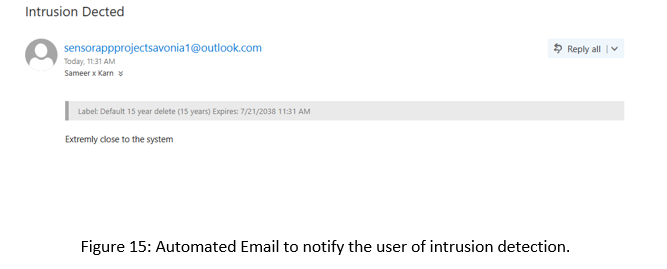
The yellow led in the above image acts as a visual indicator to the system of how close someone is getting to the design, and the program in our backend picks it up. It sends an email notification to the user.
5. Conclusion
Using the concept of both software development and embedded system, this IoT project is comprised of both technologies that provide the user the abstraction of simplicity, only needing to deal with its use with a very user-friendly interface where they can see all kinds of data, making decisions based on it, also providing the privileged based decision such as admin and for students and control IoT systems.
In a nutshell, the entire stack plus IoT system project was a success, which demonstrated how we could use the available technologies to create software that is in harmony with the hardware’s creating a system, which for this project might just have been a prototype but opens many possibilities of how fun and useful the technologies are to work with.
The project handled the real-time visualization of different sensor data, such as temperature, humidity, and intrusion. Despite being a prototype, it demonstrated a promising result for future projects that can be built on a low-budget yet quality product, which is good for both the producers and consumers.
It was also able to depict how easily the IoT project could be scaled efficiently, which would help maintain low latency and fast speed for different kinds of requests.
Authors: Sameer Karn, Rajeev Kanth