Savonia Article: Solar Panel ROI at Savonia AMK UAS Varkaus: Performance, Insights, and Future Directions
This work is licensed under CC BY-SA 4.0![]()
![]()
![]()
Introduction
The transition to renewable energy is a defining challenge and opportunity for modern campuses. At Savonia University of Applied Sciences, Varkaus Campus, a solar panel installation has been closely monitored over a 217-day period (27.01 – 31.08, 2025), providing a wealth of real-world data. This article explores the system’s operational performance, key metrics, and actionable recommendations, offering a transparent look at what solar energy can deliver in a campus environment beyond just financial and environmental savings.
System Overview and Performance Metrics
Installation and Monitoring
The solar panel system at Savonia AMK Varkaus was installed with a total capacity of 32.8 kWp. The analysis period covered January 27, 2025, to August 31, 2025, and relying exclusively on measured data without projections or extrapolations. This approach ensures that all insights are based on actual performance rather than estimates or models.
Key Performance Indicators
Solar Contribution: The system supplied 12.7% of the building’s total electricity consumption during the analysis period, demonstrating a meaningful impact on energy sourcing.
Capacity Factor: At 14.5%, the capacity factor reflects the system’s efficiency in converting available sunlight into usable electricity. This metric is crucial for understanding how well the installation performs relative to its theoretical maximum.
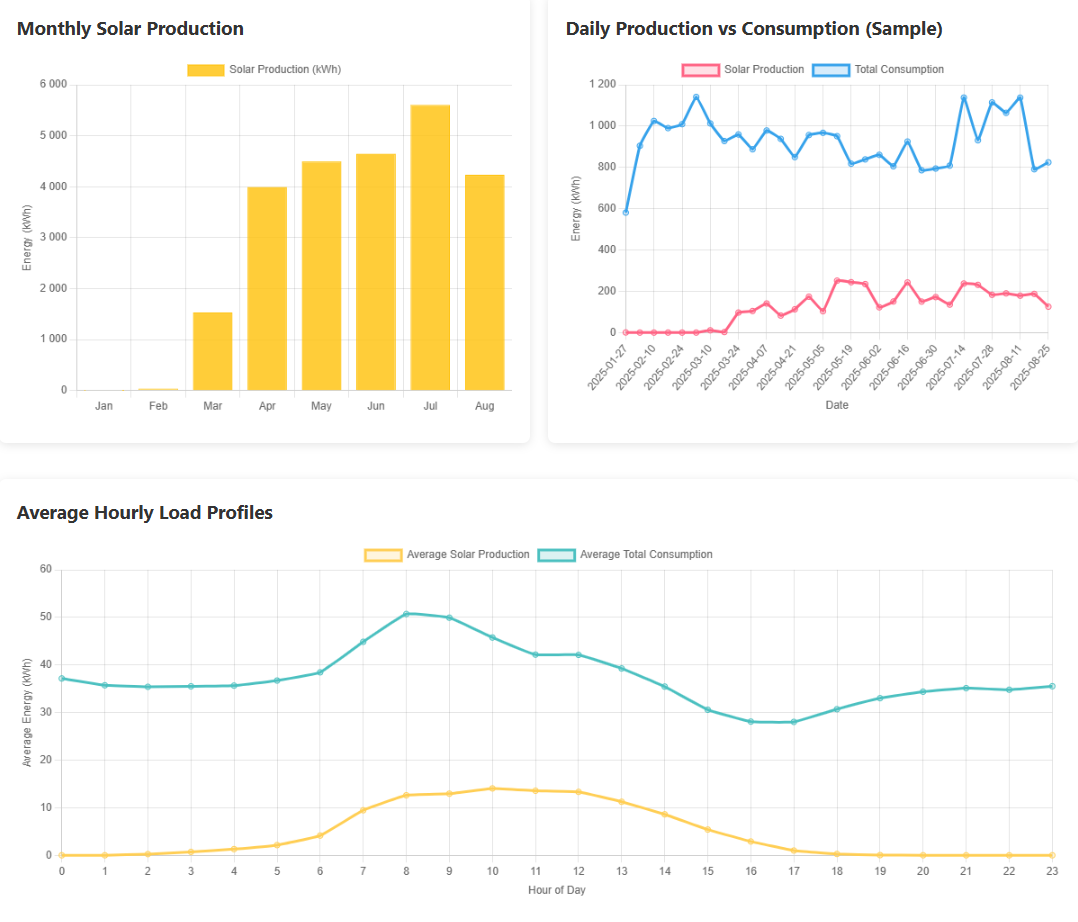
Total Solar Production: Over 217 days, the panels generated 24,529 kWh of electricity, with a daily average of 113.0 kWh.
Energy Independence Rate: The campus achieved an average energy independence rate of 12.7%, indicating the proportion of its electricity needs met directly by solar power.
Load Profiles and Consumption Patterns
Detailed monitoring revealed consistent daily and monthly production patterns. Hourly load profiles showed how solar generation aligns with campus consumption, highlighting opportunities for load matching and optimization. The data suggests that while solar can significantly offset grid reliance, strategic adjustments in consumption could further enhance self-sufficiency. Figure 1 is displaying patterns of solar production during the period of analysis.
Operational Insights and Recommendations
Performance Assessment
The system’s capacity factor and solar contribution are both within acceptable and significant ranges for the region and installation type. Reliability has been a standout feature, with consistent energy production and minimal downtime reported.
Recommendations for Optimization
Extended Monitoring: Continue collecting data across all seasons to capture performance variations and identify trends.
Maintenance Protocols: Implement regular cleaning and maintenance to sustain optimal output and prevent efficiency losses.
Performance Analysis: Investigate opportunities to improve the capacity factor, such as adjusting panel orientation or upgrading system components.
Load Matching: Analyse and adjust campus consumption patterns to better align with peak solar production, maximizing direct use of generated energy.
Documentation: Maintain detailed performance logs to support future analysis, expansion planning, and reporting.
Future Directions
Seasonal Analysis: A full-year dataset will enable deeper insights into how weather and seasonal changes affect solar output.
System Expansion: Based on proven performance, consider scaling up the installation to further increase energy independence.
Storage Integration: Evaluate the potential for battery storage to enhance self-consumption and reduce reliance on external power sources during non-sunny periods.
Conclusion
The solar panel installation at Savonia UAS Varkaus has demonstrated robust and reliable performance over its initial 217 days of operation. With a 12.7% contribution to campus electricity needs and a 14.5% capacity factor, the system has proven its value as a cornerstone of the campus’s energy strategy. Continued monitoring, optimization, and strategic planning will be key to unlocking even greater benefits in the future.
This analysis, rooted in actual measured data, provides a transparent and actionable roadmap for other institutions considering solar investments. By focusing on operational metrics and system insights, Savonia AMK UAS Varkaus sets a strong example for data-driven energy management.
Authors:
Shahbaz Baig, RDI Specialist, DigiCenter, Savonia-ammattikorkeakoulu, shahbaz.baig@savonia.fi
Premton Canamusa, RDI Specialist, DigiCenter, Savonia-ammattikorkeakoulu, premton.canamusa@savonia.fi
Mika Leskinen, RDI Specialist, DigiCenter, Savonia-ammattikorkeakoulu, mika.leskinen@savonia.fi
Aki Happonen, Digital Development Manager, DigiCenter, Savonia-ammattikorkeakoulu, aki.happonen@savonia.fi
Laura Leppänen, RDI Specialist, Savonia-ammattikorkeakoulu Oy, laura.leppanen@savonia.fi